“There was something special. Every person in California has something in mind about See’s Candies and overwhelmingly it was favorable. They had taken a box on Valentine’s Day to some girl and she had kissed him… See’s Candies means getting kissed. If we can get that in the minds of people, we can raise prices.” —Warren Buffett
This post contains my answers to the questions posted at CSInvesting.org as part of the DEEP VALUE course and the case study on See’s Candy. Feel free to comment and share your own views, reflections and take-aways.
Company Overview
A brief description of See’s Candy as of today:
See’s Candy Shops, Inc. produces boxed chocolates and candies. The company offers chocolate assortments, nuts and chews, decadent chocolate truffles, milk and dark chocolates, brittles and toffees, truffles, lollypops, candy bars, gift cards, and kosher categories. It offers products online, as well as through its shops in the United Sates, Hong Kong, Japan, and Macau. The company was founded in 1921 and is headquartered in Carson, California. (Source: Bloomberg)
Financial Data and Operating Metrics
From the current description of the business, let’s turn back to the time when Buffett and Munger purchased See’s, that is in the beginning of the 70’s.
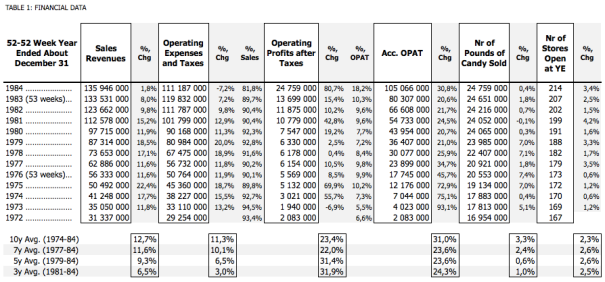
From the financials disclosed by Warren in his shareholder letters we can see that See’s development has been excellent. Growing sales revenues translating into higher operating profits. See’s excellence is, to a great extent, derived from its ability to raise prices along with and also above the rate of inflation and at the same time requiring very limited investment in tangible assets.
A look at the development in the number of pounds of candy sold shows that during the same time period (1972 to 1984) as revenues more than quadrupled, operating profit after taxes increased more than tenfold, the number of pounds of candy sold increased only 46%. That’s right, just 46% during this 12 year period, or at an average growth rate per year of 3.2%. So, the great growth rate shown by sales revenues, was not due to volume growth, but to price.
If we take a look at sales revenues, operating expenses (OPEX) and operating profit after taxes (OPAT) on a per-pound basis, it’s clear that at the same time as sales revenue grew, operating expenses were managed in a good way which resulted in great growth in operating profit after taxes.
Looking at the data broken down on a per store level the same can be seen even here. Rising revenues per store, rising OPEX (even though at a lower rate than the growth in revenues), which contributed to the great growth rate in OPAT per store. At the same time the number of pounds of candy sold per store was growing real slow, and even turned negative for three of the four periods for which averages are calculated (see table below).
And finally, from where can any support for the pricing power of See’s be derived? If growth in sales revenues is compared to volume growth from the number of pounds of candy sold, we get a rough measure of the price increase each year (before inflation, i.e., nominal amounts). Taking inflation into account in the next step then gives the real price increases, that is any amount of the total price increase each year that remains when inflation for the same period is taken into account.
A year-to-year comparison does not always show any clear signs, growth between single years can go in opposite ways even when the underlying trend during a couple of years tells another tale. Instead, from looking at longer time periods it can be seen that See’s has not just been able to raise prices to match inflation, See’s also was able to raise prices at a rate higher than inflation, i.e., in real terms. (Any input regarding the pricing power issue of See’s and how to derive it would be greatly appreciated. Does my thinking make sense, or should something maybe be reconsidered here in my attempt to try to find the key to the “untapped pricing power” of See’s (both in nominal and real terms) Feel free to comment!)
Describe the competitive advantages of See’s.
In our primary marketing area, the West, our candy is preferred by an enormous margin to that of any competitor. In fact, we believe most lovers of chocolate prefer it to candy costing two or three times as much. (In candy, as in stocks, price and value can differ; price is what you give, value is what you get.)
—Warren Buffett, 1983 Letter to Shareholders
See’s moat most likely stems from:
- CAPTIVE CUSTOMERS through habit formation and maybe even some kind of emotional switching costs due to psychological reasons coming from the influence from mere-association tendency and the social proof tendency (both discussed by Charlie Munger in his speech The Psychology of Human Misjudgment), and
- LOCAL ECONOMIES OF SCALE in advertising and distribution.
For a hint on why it seems likely to assume the presence of LOCAL ECONOMIES OF SCALE even some decades ago, take a quick look at the map below showing some 186 See’s stores in California AS OF TODAY (Source: ca.sees.com). This concentration reminds me of the Walmart map that I posted in another post (see here).
Could this be a faster growing business if See’s sold through other marketing channels?
See’s most likely would be able to increase its growth rate (in volume) if it was sold through other marketing channels. But, would it still be as profitable? Probably not. But as we can see from an analysis of See’s moat and its sources, the moat sources are most favorable in California, and thus probably less so in other parts of the U.S.
How does Buffett analyze this business?
- Poundage volume
- Units sold per store
The poundage volume in our retail stores has been virtually unchanged each year for the past four, despite small increases every year in the number of shops (and in distribution expense as well). Of course, dollar volume has increased because we have raised prices significantly. But we regard the most important measure of retail trends to be units sold per store rather than dollar volume. On a same-store basis (counting only shops open throughout both years) with all figures adjusted to a 52-week year, poundage was down .8 of 1% during 1983.
—Warren Buffett, 1983 Letter to Shareholders
- Per-pound realization
- Per-pound costs
- Same store-volume
During 1984 we increased prices considerably less than has been our practice in recent years: per-pound realization was $5.49, up only 1.4% from 1983. Fortunately, we made good progress on cost control, an area that has caused us problems in recent years. Per-pound costs – other than those for raw materials, a segment of expense largely outside of our control – increased by only 2.2% last year.
Our cost-control problem has been exacerbated by the problem of modestly declining volume (measured by pounds, not dollars) on a same-store basis. Total pounds sold through shops in recent years has been maintained at a roughly constant level only by the net addition of a few shops annually. This more-shops-to-get-the-same-volume situation naturally puts heavy pressure on per-pound selling costs.
In 1984, same-store volume declined 1.1%. Total shop volume, however, grew 0.6% because of an increase in stores. (Both percentages are adjusted to compensate for a 53-week fiscal year in 1983.)
—Warren Buffett, 1984 Letter to Shareholders

What price did Buffett pay and why?
See’s is a slow grower, but its growth is steady and reliable—and best of all, it doesn’t take additional infusions of capital.
—Damn Right! Behind the Scenes with Berkshire Hathaway Billionaire Charlie Munger
Purchase price for See’s amounted to $25 million, a business earning $4 million pre-tax and $2 million after-tax, from $8 million in tangible assets (25% after-tax ROC or 50% pre-tax ROC), which translates into these key ratios:
- 12,5 times after-tax earnings (8% yield)
- 6,3 times pre-tax earnings (16% yield)
- 3 times invested capital
In comparison, the 10-year treasury rate in January 1972 was 5.95 percent.
Harry See’s asked for $30 million, but Buffett and Munger weren’t willing to pay more than $25 million, since this was a lot higher than the capital invested in the business. Harry See’s finally accepted the price of $25 million and Buffett and Munger, through Blue Ship Stamps, acquired a great franchise.


Truly Amazing Post! Thanks!
Thanks. Glad to hear you liked it.
Greetings from 2019! Glad to see such an impressive case study about See’s Candy! I have some questions about the calculation of the revenue in Table 4. For the calculation of the nominal price increase, I think using the percentage change in (revenue/pounds sold) instead of the difference between the two factors’ percentage change( sales rev. % chg, Nr of pounds % chg) would be more suitable. Thanks!